Figure 2
Vestibular-limbic relationships: Brain mapping
Paolo Gamba*
Published: 16 March, 2018 | Volume 2 - Issue 1 | Pages: 007-013

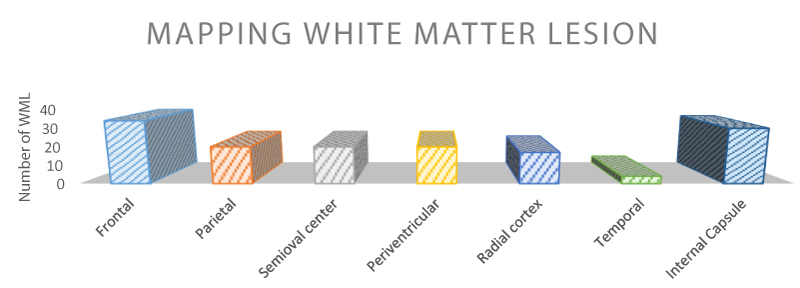
Figure 2:
Mapping of White Matters Lesions. The table shows the frequency of mapped WML in the different anatomical regions in 90 patients suffering from vascular vertigo. The results showed that the most frequent WML sites were frontal and internal capsule areas. The total number of lesions is greater than the number of patients because one patient can have more than one lesion.
Read Full Article HTML DOI: 10.29328/journal.ida.1001006 Cite this Article Read Full Article PDF
More Images
Similar Articles
-
Burnout and Related Factors in Caregivers of outpatients with SchizophreniaHatice Demirbas*,Erguvan Tugba Ozel Kizil. Burnout and Related Factors in Caregivers of outpatients with Schizophrenia. . 2017 doi: 10.29328/journal.hda.1001001; 1: 001-011
-
Anxiety and depression as an effect of birth order or being an only child: Results of an internet survey in Poland and GermanyJochen Hardt*,Lisa Weyer,Malgorzata Dragan,Wilfried Laubach. Anxiety and depression as an effect of birth order or being an only child: Results of an internet survey in Poland and Germany. . 2017 doi: 10.29328/journal.hda.1001003; 1: 015-022
-
Vestibular-limbic relationships: Brain mappingPaolo Gamba*. Vestibular-limbic relationships: Brain mapping. . 2018 doi: 10.29328/journal.ida.1001006; 2: 007-013
-
Responding to Disasters: More than economic and infrastructure interventionsDavid Crompton OAM*,Ross Young,Jane Shakespeare-Finch,Beverley Raphael AM. Responding to Disasters: More than economic and infrastructure interventions. . 2018 doi: 10.29328/journal.ida.1001007; 2: 014-028
-
Anti-anxiety effects in mice following acute administration of Ficus Thonningii (wild fig)Aduema W*,Akunneh-Wariso C,Ejiofo DC,Amah AK. Anti-anxiety effects in mice following acute administration of Ficus Thonningii (wild fig). . 2018 doi: 10.29328/journal.ida.1001009; 2: 040-047
-
Translation, adaptation and validation of Depression, Anxiety and Stress Scale in UrduWaqar Husain*,Amir Gulzar. Translation, adaptation and validation of Depression, Anxiety and Stress Scale in Urdu. . 2020 doi: 10.29328/journal.ida.1001011; 4: 001-004
-
Depression as a civilization-deformed adaptation and defence mechanismBohdan Wasilewski*,Olha Yourtsenyuk,Eugene Egan. Depression as a civilization-deformed adaptation and defence mechanism. . 2020 doi: 10.29328/journal.ida.1001013; 4: 008-011
-
The different levels of depression and anxiety among Pakistani professionalsSehrish Hassan*,Waqar Husain. The different levels of depression and anxiety among Pakistani professionals. . 2020 doi: 10.29328/journal.ida.1001014; 4: 012-018
-
Impact of Christian meditation and biofeedback on the mental health of graduate students in seminary: A pilot studyPaul Ratanasiripong*,Sun Tsai . Impact of Christian meditation and biofeedback on the mental health of graduate students in seminary: A pilot study. . 2020 doi: 10.29328/journal.ida.1001015; 4: 019-024
-
Therapeutic application of herbal essential oil and its bioactive compounds as complementary and alternative medicine in cardiovascular-associated diseasesAhmad Firdaus B Lajis*,Noor Hanis Ismail. Therapeutic application of herbal essential oil and its bioactive compounds as complementary and alternative medicine in cardiovascular-associated diseases. . 2020 doi: 10.29328/journal.ida.1001016; 4: 025-036
Recently Viewed
-
Analysis and Control of a Glucose-insulin Dynamic ModelLakshmi N Sridhar*. Analysis and Control of a Glucose-insulin Dynamic Model. Ann Clin Endocrinol Metabol. 2026: doi: 10.29328/journal.acem.1001033; 10: 010-016
-
Physical Performance in the Overweight/Obesity Children Evaluation and RehabilitationCristina Popescu, Mircea-Sebastian Șerbănescu, Gigi Calin*, Magdalena Rodica Trăistaru. Physical Performance in the Overweight/Obesity Children Evaluation and Rehabilitation. Ann Clin Endocrinol Metabol. 2024: doi: 10.29328/journal.acem.1001030; 8: 004-012
-
Germline BRCA1 Mutation inSquamous Cell Carcinoma of Oesophagus: Driver versus Passenger MutationAmrit Kaur Kaler*, Shraddha Manoj Upadhyay, Nandini Shyamali Bora, Ankita Nikam, Kavya P, Nivetha Athikeri, Dattatray B Solanki, Imran Shaikh, Rajesh Mistry. Germline BRCA1 Mutation inSquamous Cell Carcinoma of Oesophagus: Driver versus Passenger Mutation. J Genet Med Gene Ther. 2024: doi: 10.29328/journal.jgmgt.1001011; 7: 015-019
-
Oral Candida colonization in HIV-infected patients: Species and antifungal susceptibility in Tripoli/LibyaEllabib M*,Mohamed H,Mokthar E,Ellabib M,El Magrahi H,Eshwika A. Oral Candida colonization in HIV-infected patients: Species and antifungal susceptibility in Tripoli/Libya . Int J Clin Microbiol Biochem Technol. 2018: doi: 10.29328/journal.ijcmbt.1001001; 1: 001-008
-
Evaluation of novel culture media prepared from plant substrates for isolation and identification of Cryptococcus Neoformans Species ComplexEllabib M*,Krema ZA,Mokthar ES,El Magrahi HS,Eshwika A,Cogliati M. Evaluation of novel culture media prepared from plant substrates for isolation and identification of Cryptococcus Neoformans Species Complex. Int J Clin Microbiol Biochem Technol. 2018: doi: 10.29328/journal.ijcmbt.1001002; 1: 009-013
Most Viewed
-
Effects of dietary supplementation on progression to type 2 diabetes in subjects with prediabetes: a single center randomized double-blind placebo-controlled trialSathit Niramitmahapanya*,Preeyapat Chattieng,Tiersidh Nasomphan,Korbtham Sathirakul. Effects of dietary supplementation on progression to type 2 diabetes in subjects with prediabetes: a single center randomized double-blind placebo-controlled trial. Ann Clin Endocrinol Metabol. 2023 doi: 10.29328/journal.acem.1001026; 7: 00-007
-
Physical Performance in the Overweight/Obesity Children Evaluation and RehabilitationCristina Popescu, Mircea-Sebastian Șerbănescu, Gigi Calin*, Magdalena Rodica Trăistaru. Physical Performance in the Overweight/Obesity Children Evaluation and Rehabilitation. Ann Clin Endocrinol Metabol. 2024 doi: 10.29328/journal.acem.1001030; 8: 004-012
-
Hypercalcaemic Crisis Associated with Hyperthyroidism: A Rare and Challenging PresentationKarthik Baburaj*, Priya Thottiyil Nair, Abeed Hussain, Vimal MV. Hypercalcaemic Crisis Associated with Hyperthyroidism: A Rare and Challenging Presentation. Ann Clin Endocrinol Metabol. 2024 doi: 10.29328/journal.acem.1001029; 8: 001-003
-
Exceptional cancer responders: A zone-to-goDaniel Gandia,Cecilia Suárez*. Exceptional cancer responders: A zone-to-go. Arch Cancer Sci Ther. 2023 doi: 10.29328/journal.acst.1001033; 7: 001-002
-
The benefits of biochemical bone markersSek Aksaranugraha*. The benefits of biochemical bone markers. Int J Bone Marrow Res. 2020 doi: 10.29328/journal.ijbmr.1001013; 3: 027-031

If you are already a member of our network and need to keep track of any developments regarding a question you have already submitted, click "take me to my Query."


